Philips – Health
For this practical assignment Philips gave us three datasets to work with. The first data set was a list with all the employees which work or worked for Philips design including a list with projects they had worked on. The second data set we had to extract from multiple presentations and keynotes concerning the awards Philips had won over the last years. Thi third and final dataset we had to make ourselves using sensors.
We sensors and device given to us we where able to measures the moisture levels (GSR) and the heart beat interval (IBI). In order to get meaningful data from these sensors our class setup a simple program in which we would do different activities. The program consistent out of different segments in example one segment consistent of heavy physical activity (running up and down the stair for twenty times) whereas another would be listening to relaxing music or watching Jackass. In addition to these sensors we attached a iPhone to the participant to get additional measurements: latitude, longitude, altitude, heading and acceleration. Once collected all the data we could start with our projects.
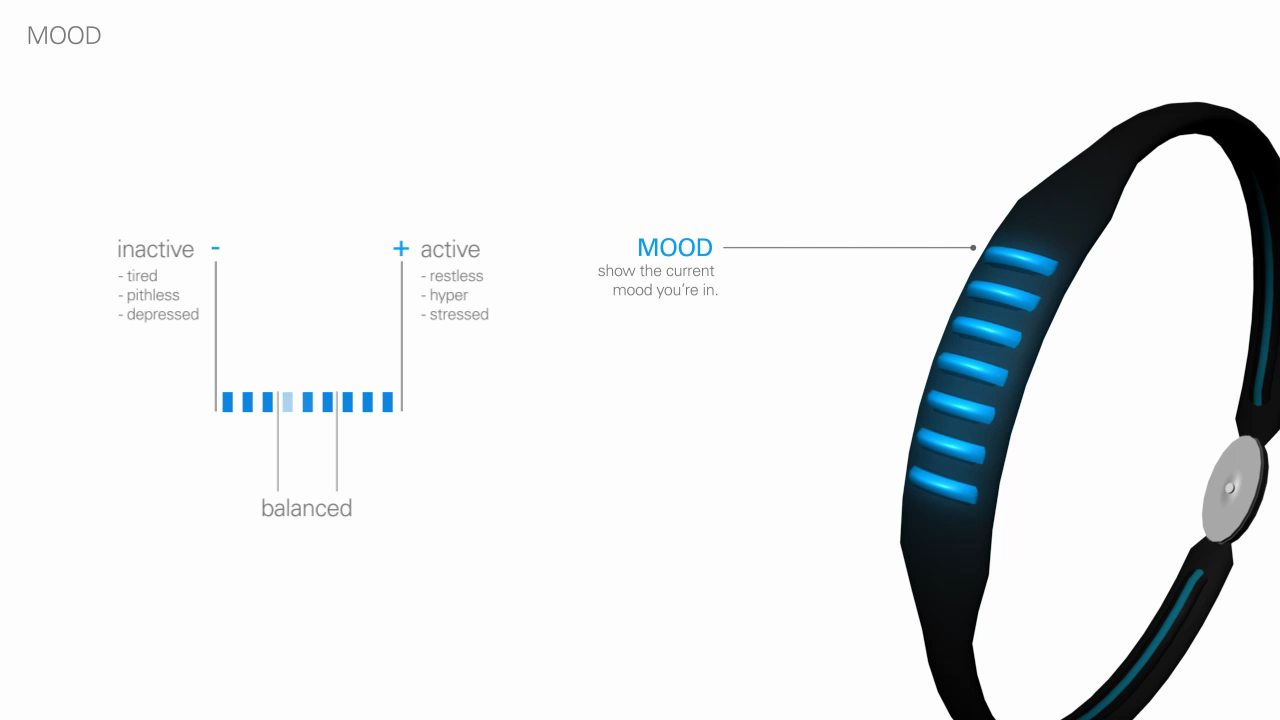
After having try several different approaches it became apparent that the visualizations would be boring and dull this because the data was too predictable. This made us decide to turn it around, could we device send the IBI adn GSR data out live? How could this look like, and how would it work? This eventually resonated in the Mood bracelet, a wearable device on which personal and environmental devices would respond to.
The concept is simple: we wanted to make the user become in balance again, and let all smart devices change to the mood the user is in to make him or her feel more at ease. In example when you are really tired the lights would become more bright and vivid trying to energize you or when you are in a bad mood happy music should start playing.

