The Virtual City – Research


With my project ‘The Virtual City’ I wanted to give the user/viewer a better insight into activity’s in the virtual city. Which is increasingly becoming more important. As a starting point I choose three city’s which exist in the real physical world namely: Arnhem, Amsterdam and Schiphol Airport.
In order to construct the virtual city, I used Facebook as the data source. The locations where chosen by its status on Facebook (public places). I tracked these locations (which varies from 200 – 500 locations per city) for a couple weeks. Which resulted in a fast amount of data (likes, check-ins, group activity and of course posts). In the final version I choose to show only the progression/cycle of a city of a week. In order to give it some extra context I selected the beginning of the 2012 European Football Cup as the start of the timeframe. This resulted in some interesting activity’s in the three city’s. Especially the first match of Holland versus Denmark (which we sadly lost).
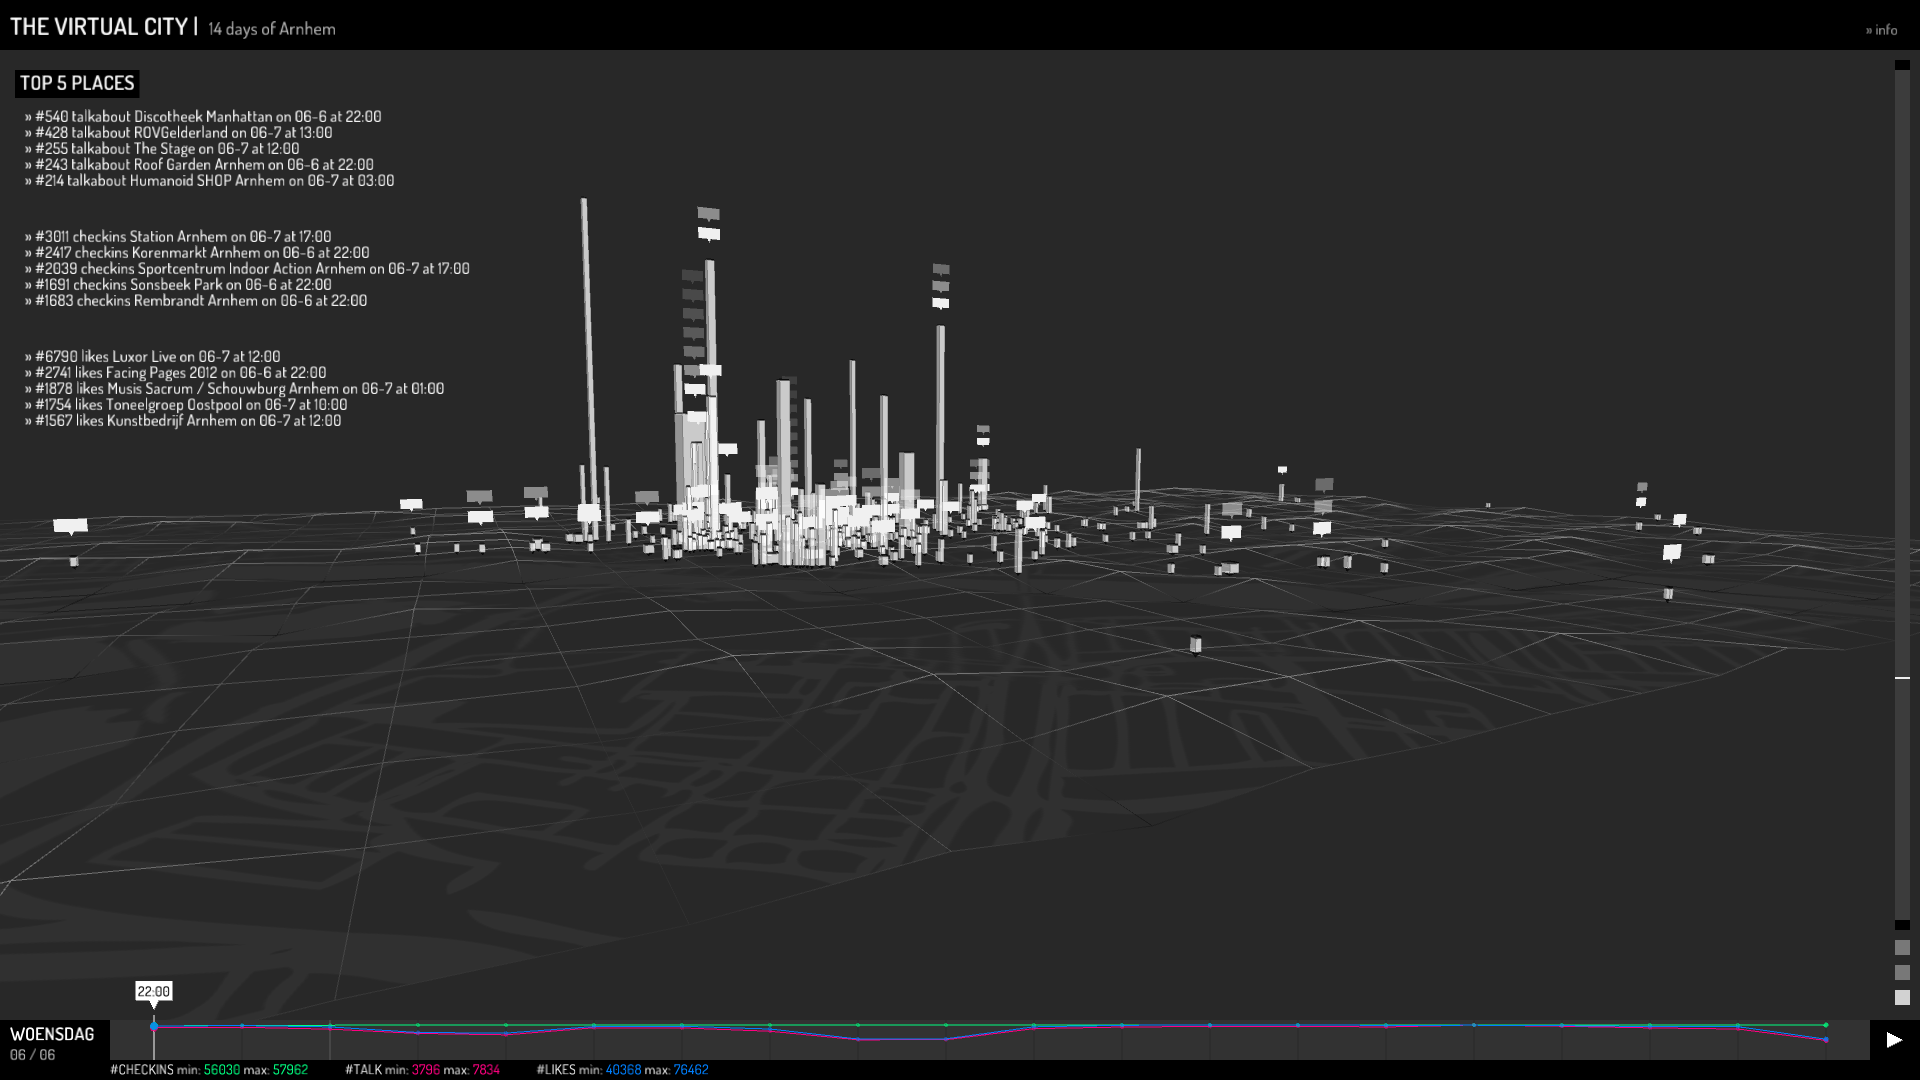
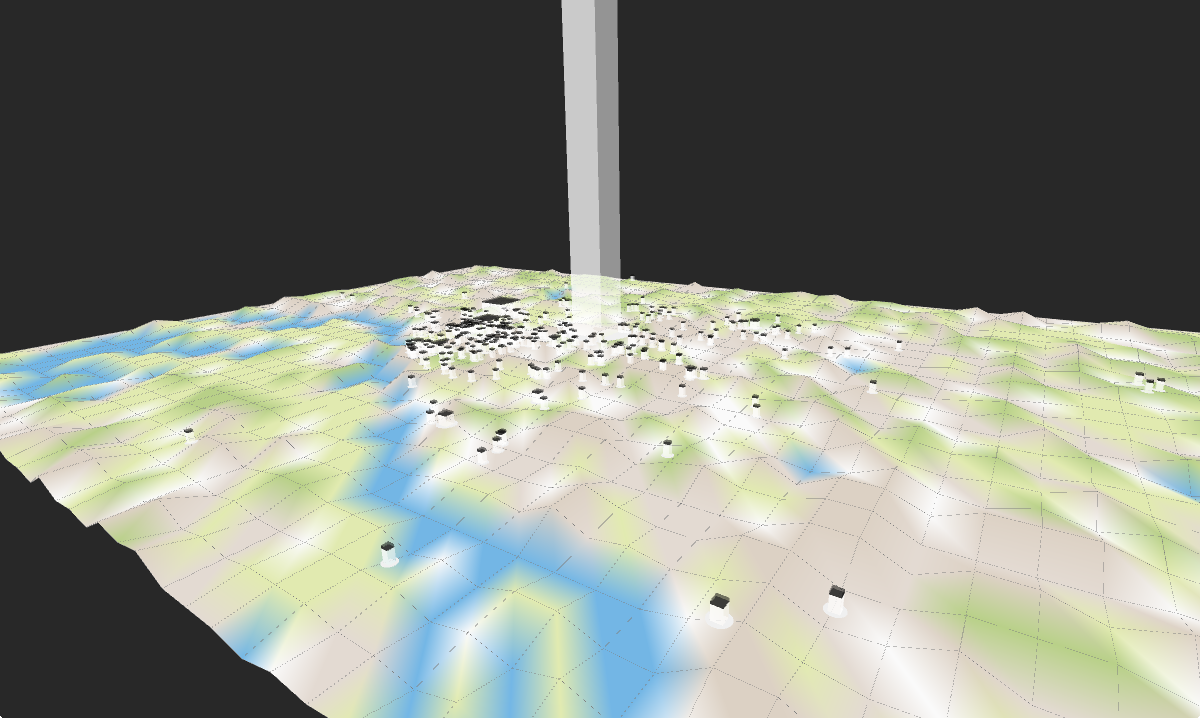
The different locations are visualized in building like shapes which are projected on a physical map op the currently selected city. The height of these ‘buildings’ are based on the number of Facebook check-ins. A check-in is a method for the Facebook user to show that they have been on that specific location, so the viewer/user will be able to see what’s a popular location in the physical world. De width of these ‘buildings’ are based on the amount of likes that where given to the specific locations. This resulted in the ability to see which locations are popular in the virtual world and therefor more important to the Facebook users.
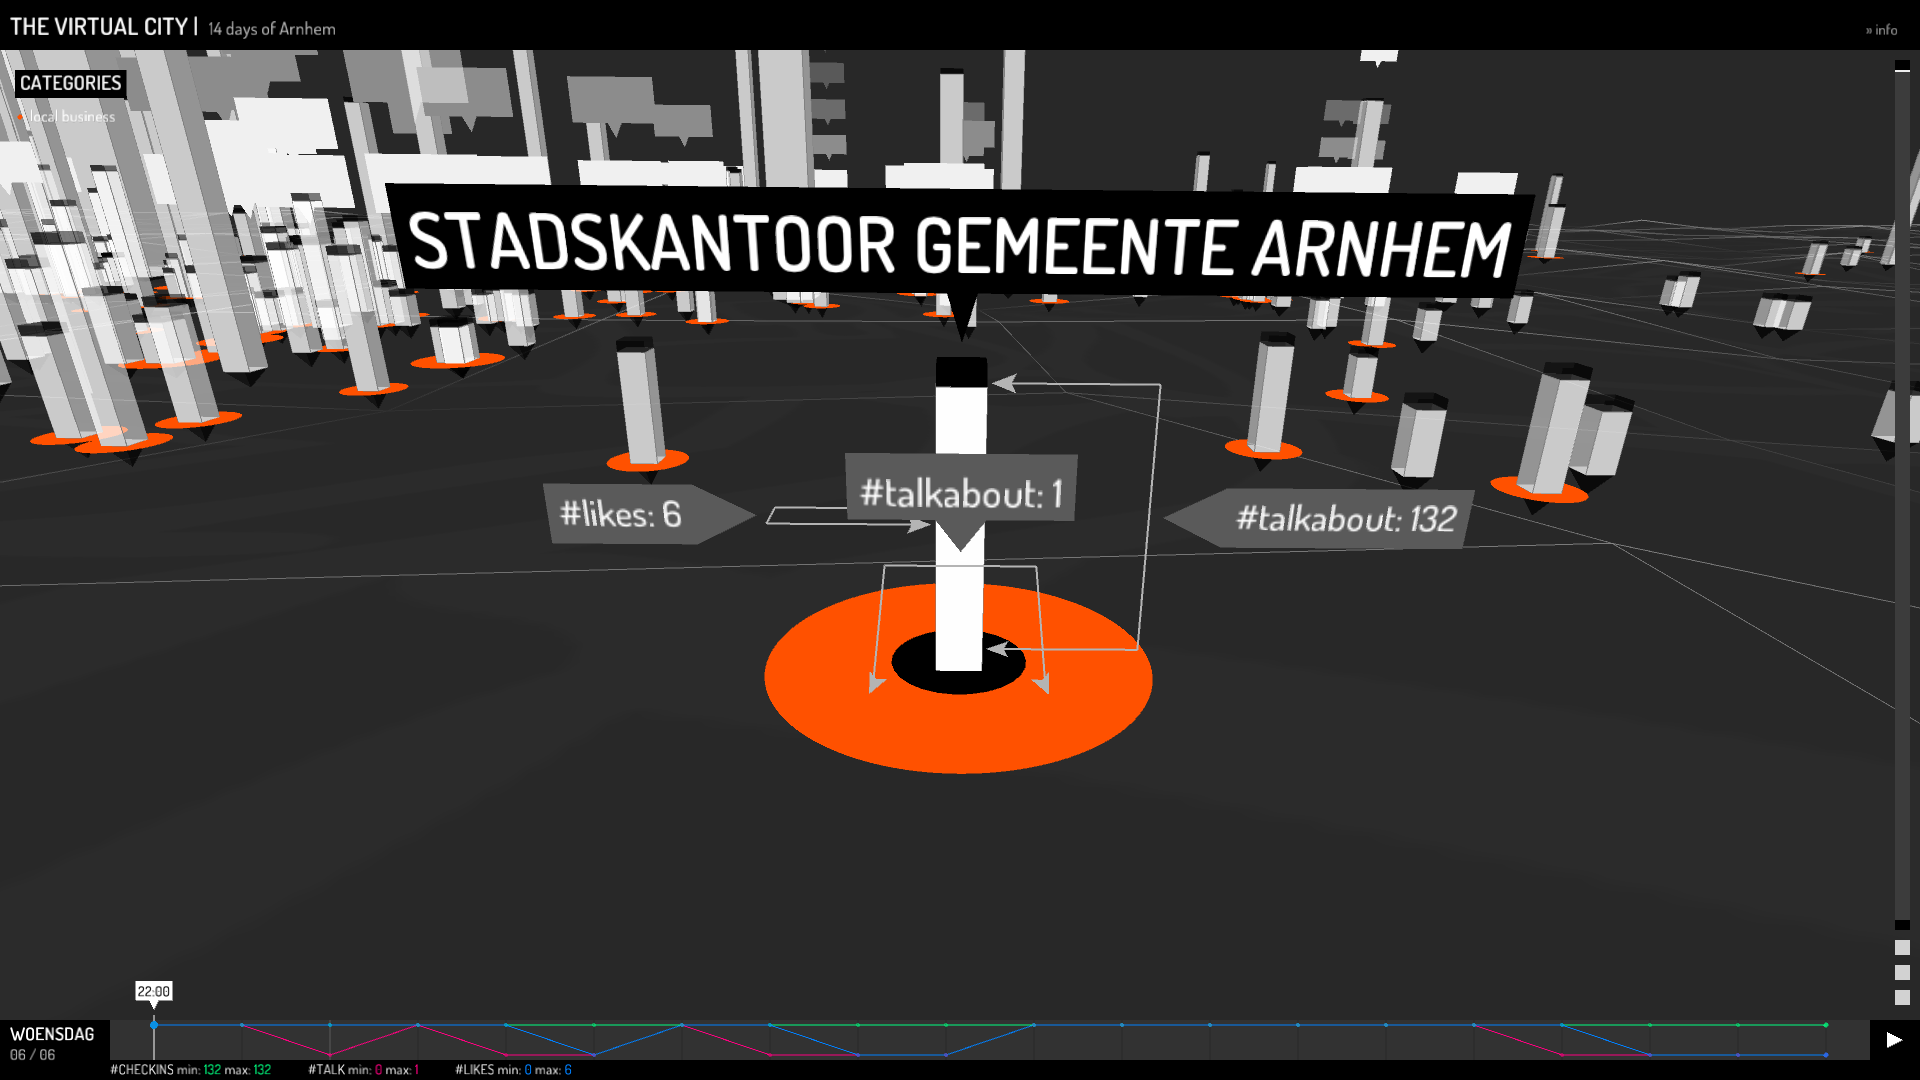
When a ‘building’ is selected the category which in the locations is been categorized will pop-out, the radius is determined by the amount of people that where currently (at the selected time) talking about this specific location. As an addition the related (determined by category) locations will highlight as well. This will give viewers/users an impression of spread having the same category. In example: nightlife areas.
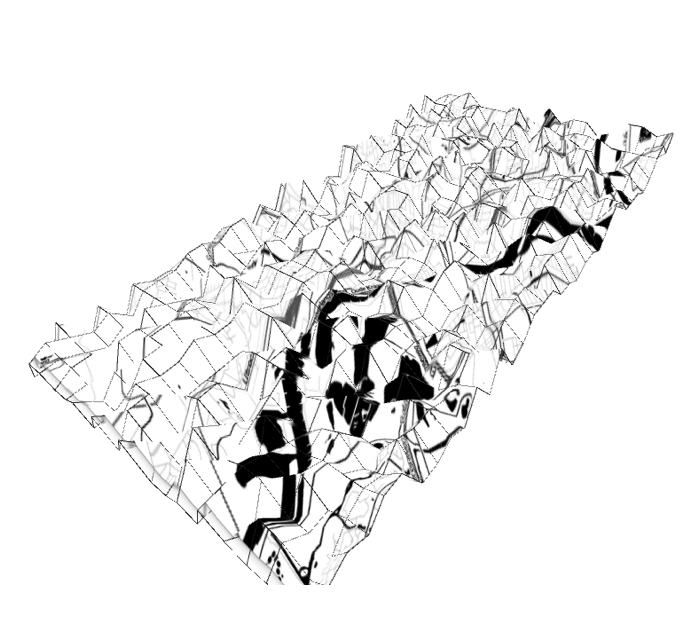
The map is being morphed based on the location that is being selected. This is being done in order to give the location more physical space as it’s more important in the virtual city.
The landscape itself (the height) is being determent by the type of environment i.e. water is mapped lower then streets or roads. This gives the city a bit more character.
In addition to plotting the locations a timeline/graph is being generated in which the user can view the progression and activity of the city. This results in certain patterns i.e. between 22:00 – 06:00 from Monday till Thursday there isn’t that much activity as there is on Friday and Saturday.
When a location is being selected it’s shows it’s own timeline instead of the city timeline. In order to give the user/viewer an overview the top five most popular locations (check-ins, likes and talk-about) are placed in the top left corner. The user can then tap on them and go right to this popular location.
When automatically playing the timeline the user/viewer will be able to see the amount of posts the particular location has posted or is been posted (by FB users). This resulted in a lively and dynamic change of activity within the city. When a location is selected the viewer/user will be read of view (when’s it’s a photo) the message.
As a conclusion the ‘Virtual City’ was an interesting project for me to work on i.e. I discovered new places where I never heard of before. Secondly it was interesting to see how certain patterns became visible by only using Facebook data. Lastly but not least it was great to see people actually using it, and exploring their city in a different way.