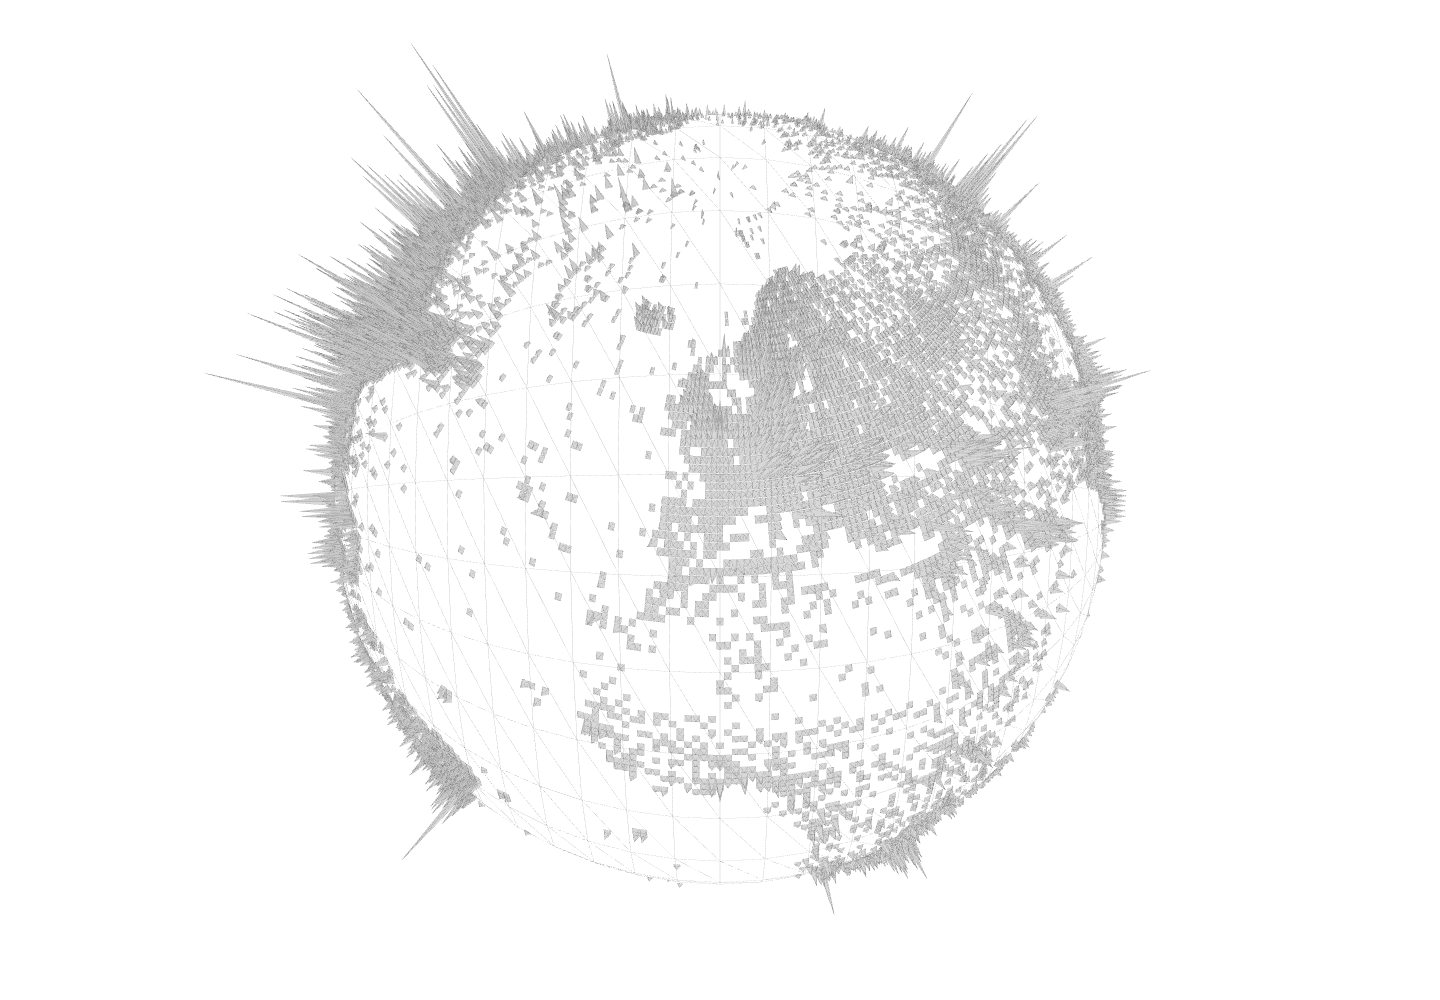
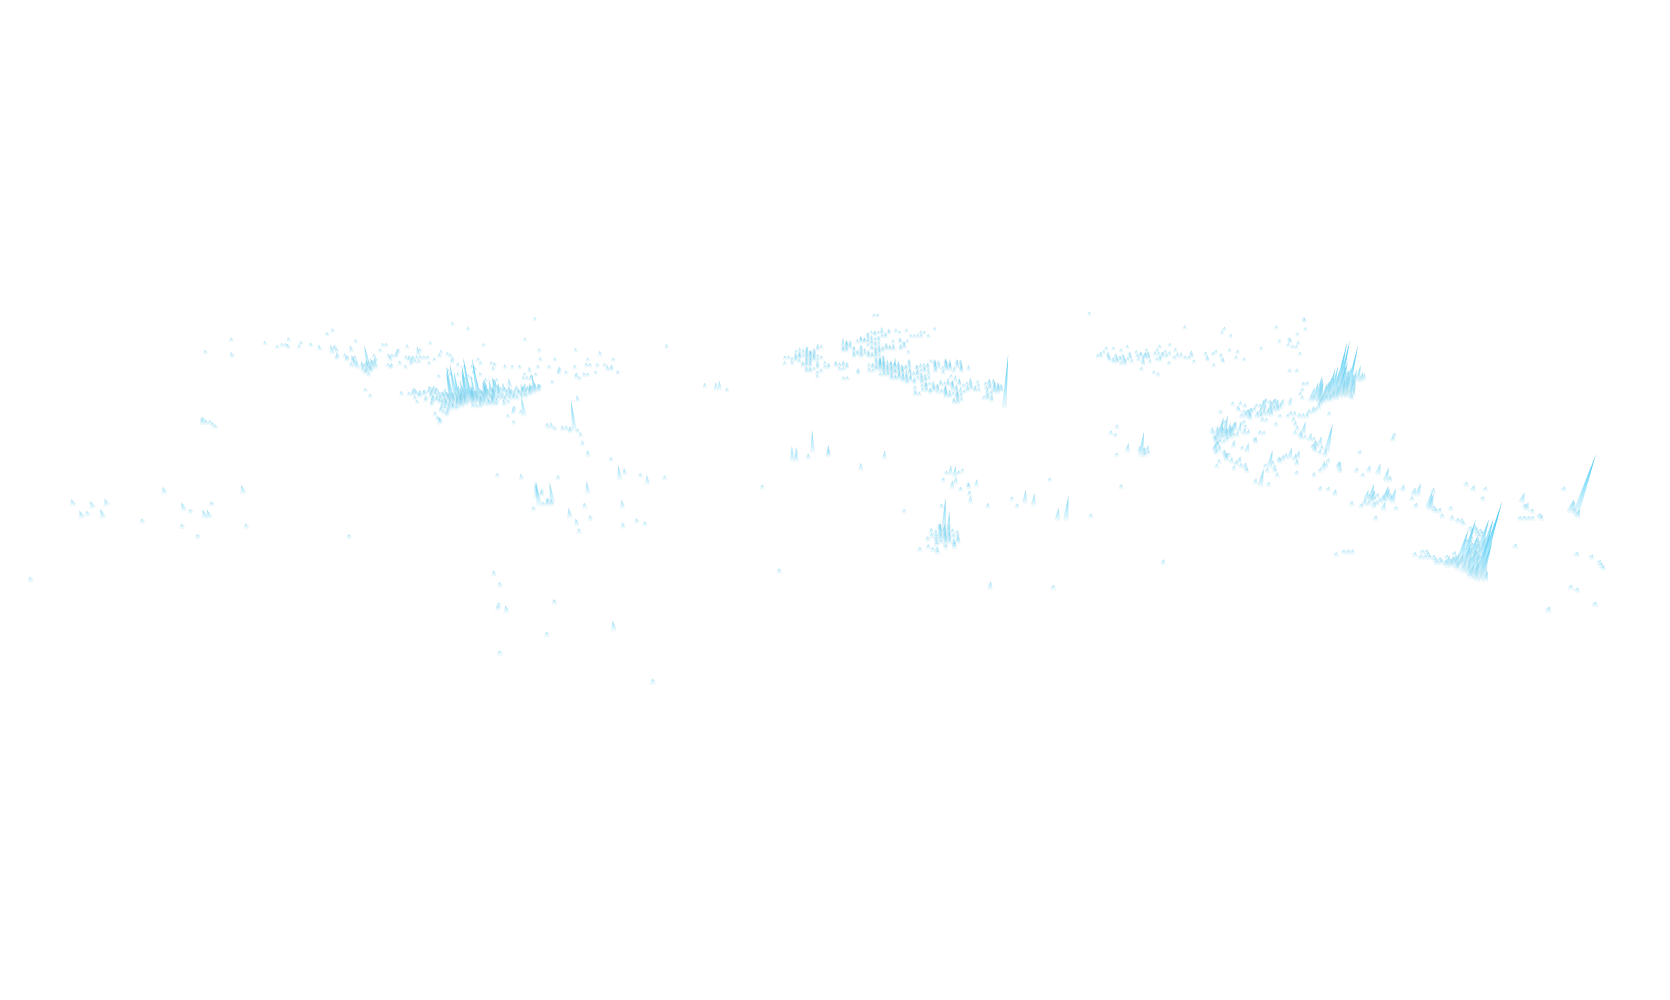
• Skip to main navigation
  • Skip to main content
  • Skip to footer
  • Home
  • About
  • Contact
  • ↳ Mastodon
  • ↳ Bluesky
  • Skip to menu toggle button

Jonas Groot Kormelink

Sandbox

  • Pinterest
  • LinkedIn
  • Twitter
  • Back to top ↑

Weather Chart 2013 – Experiments

Posted on: 11/12/2012 Last updated on: 10/01/2021 Categorized in: CLEVER°FRANKE Experiment Written by: admin

Various 3D experiments with weather data from around the globe.

Tagged as: 3D C°F Data Data Visualization Processing Weather Weather-chart
Skip back to main navigation

Post navigation

Previous Post Particle Face
Next Post Weather Chart 2013

Tags

3D (8) A/V (3) Abstract (6) Analog (9) Australia (4) Bookmarking (3) Chicago (3) C°F (25) D3 (26) Data (34) Database (10) Data Driven (5) Data Visualization (40) Experiment (40) Generated (4) Generative (8) Geography (11) GLSL (5) Google Maps (3) Illustrator (7) Interactive (54) Javascript (33) Live (3) Map (12) MapBoxGL (4) P5 (5) Particles (4) PHP (26) Pixels (4) Print (3) Privacy (3) Processing (32) Reactjs (6) Sensors (6) Slit-scan (3) Thesis (5) Three (14) Tool (5) Video (5) Virtual City (3) Weather (6) Weather-chart (3) Web (33) WebGL (13) World (3)

Categories

Art Academy Project (36) CLEVER°FRANKE Experiment (15) CLEVER°FRANKE Project (14) DataLabs Experiment (2) DataLabs Project (2) More Yum (1) Personal Experiment (20) Personal Project (3)
2025 Jonas Groot Kormelink - Sandbox
  • Pinterest
  • LinkedIn
  • Twitter
  • Back to top ↑