• Skip to main navigation
  • Skip to main content
  • Skip to footer
  • Home
  • About
  • Contact
  • ↳ Mastodon
  • ↳ Bluesky
  • Skip to menu toggle button

Jonas Groot Kormelink

Sandbox

  • Pinterest
  • LinkedIn
  • Twitter
  • Back to top ↑

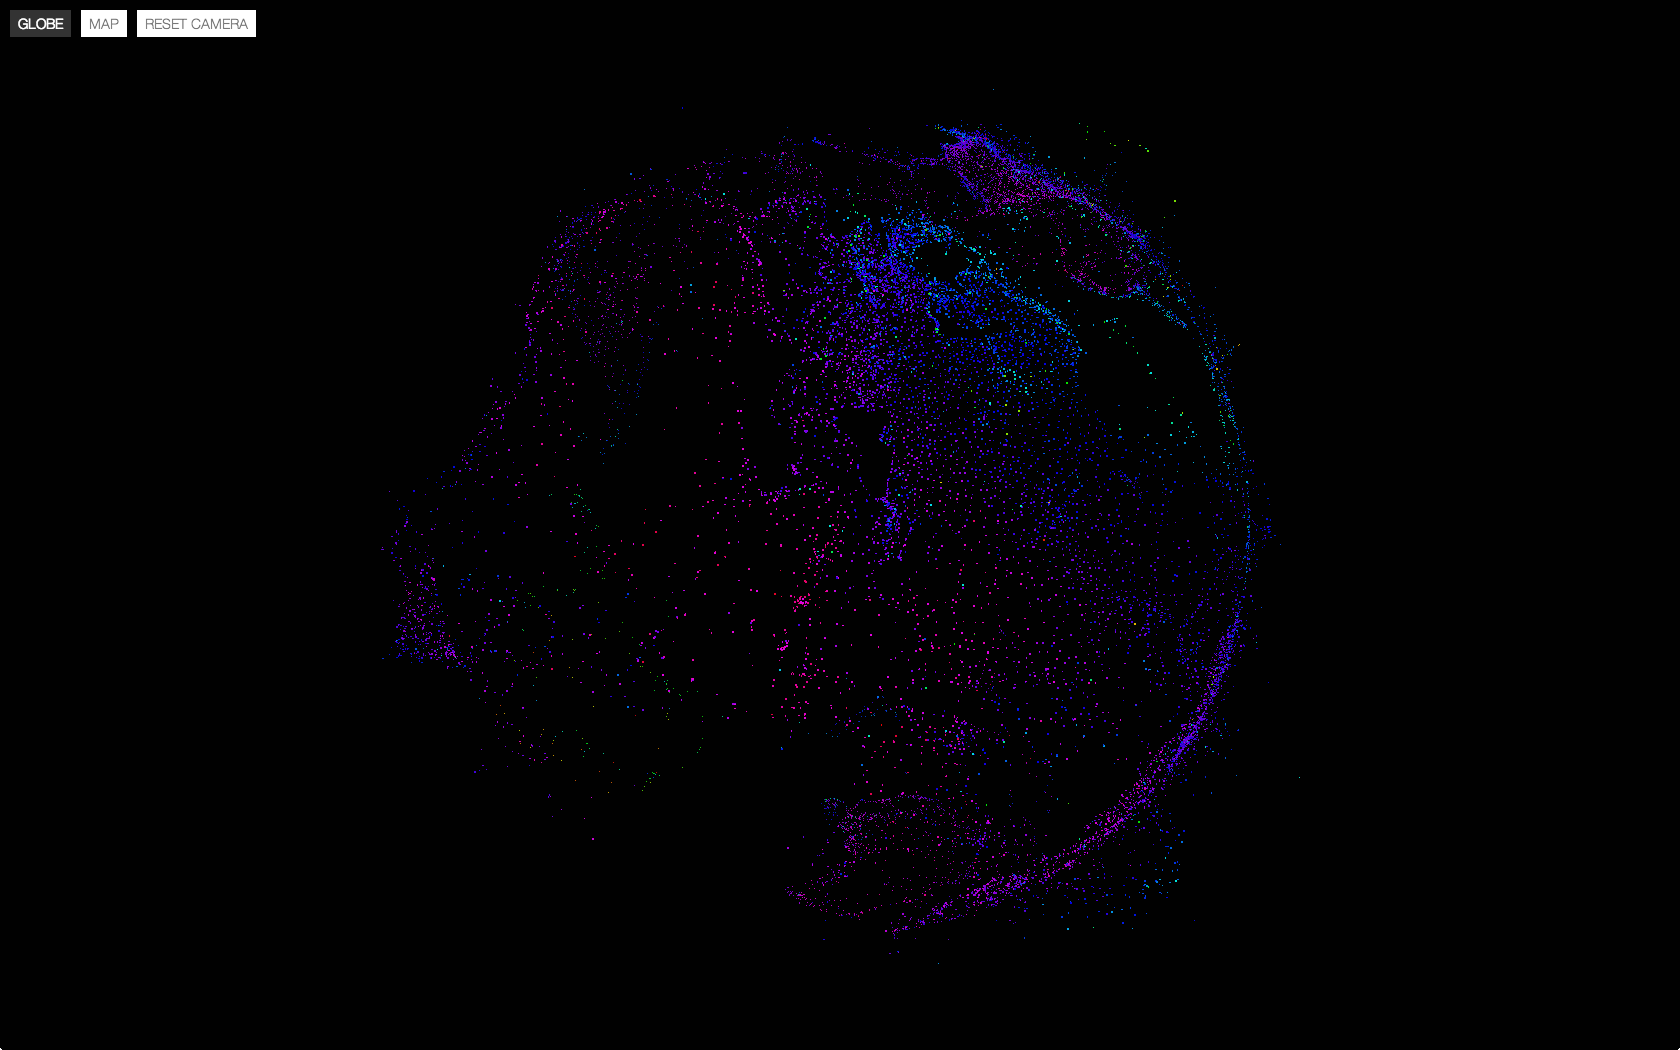
3D Weather Globe/Map

Posted on: 19/09/2013 Last updated on: 10/01/2021 Categorized in: Personal Experiment Written by: admin

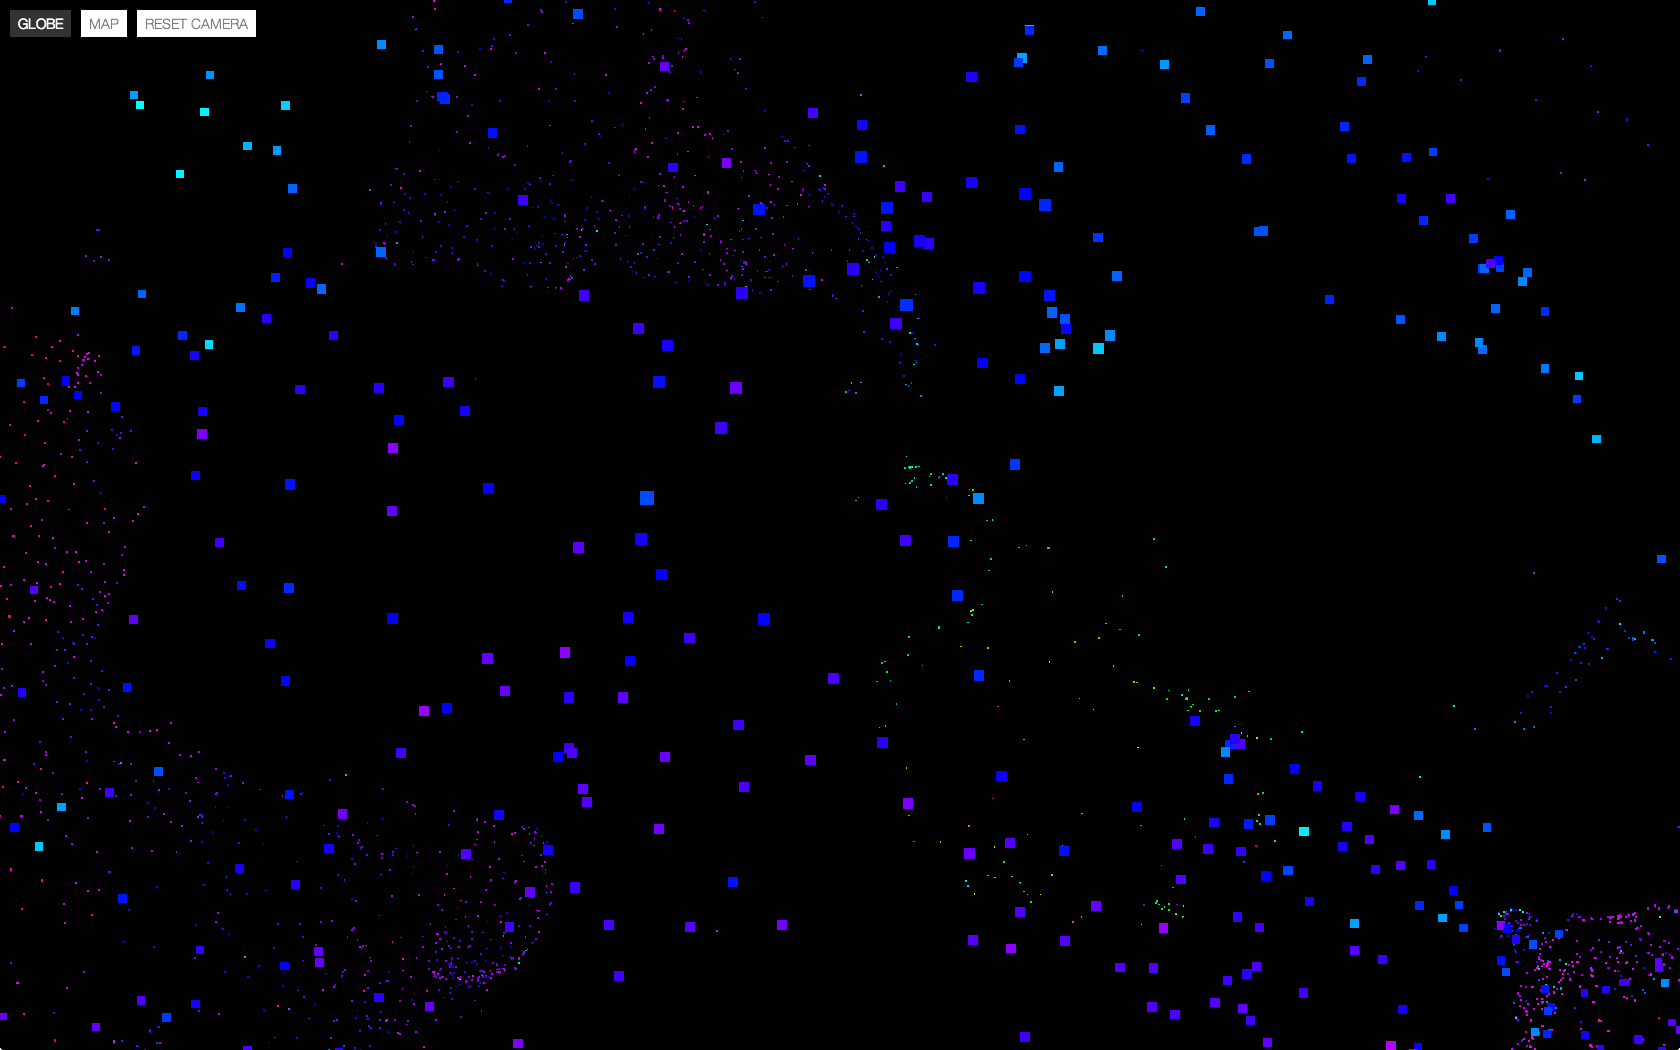
Simple 3D visualization which morphs between a 3D globe projection to a 2D projection visualizing over 10.000 weather stations.

> Live Version

Tagged as: 3D Data Data Visualization Experiment Geography Interactive Javascript Map Three Weather-stations Web WebGL
Skip back to main navigation

Post navigation

Previous Post GoShort Festival – Interactive Schedule
Next Post 3D Landscape

Tags

3D (8) A/V (3) Abstract (6) Analog (9) Australia (4) Bookmarking (3) Chicago (3) C°F (25) D3 (26) Data (34) Database (10) Data Driven (5) Data Visualization (40) Experiment (40) Generated (4) Generative (8) Geography (11) GLSL (5) Google Maps (3) Illustrator (7) Interactive (54) Javascript (33) Live (3) Map (12) MapBoxGL (4) P5 (5) Particles (4) PHP (26) Pixels (4) Print (3) Privacy (3) Processing (32) Reactjs (6) Sensors (6) Slit-scan (3) Thesis (5) Three (14) Tool (5) Video (5) Virtual City (3) Weather (6) Weather-chart (3) Web (33) WebGL (13) World (3)

Categories

Art Academy Project (36) CLEVER°FRANKE Experiment (15) CLEVER°FRANKE Project (14) DataLabs Experiment (2) DataLabs Project (2) More Yum (1) Personal Experiment (20) Personal Project (3)
2025 Jonas Groot Kormelink - Sandbox
  • Pinterest
  • LinkedIn
  • Twitter
  • Back to top ↑