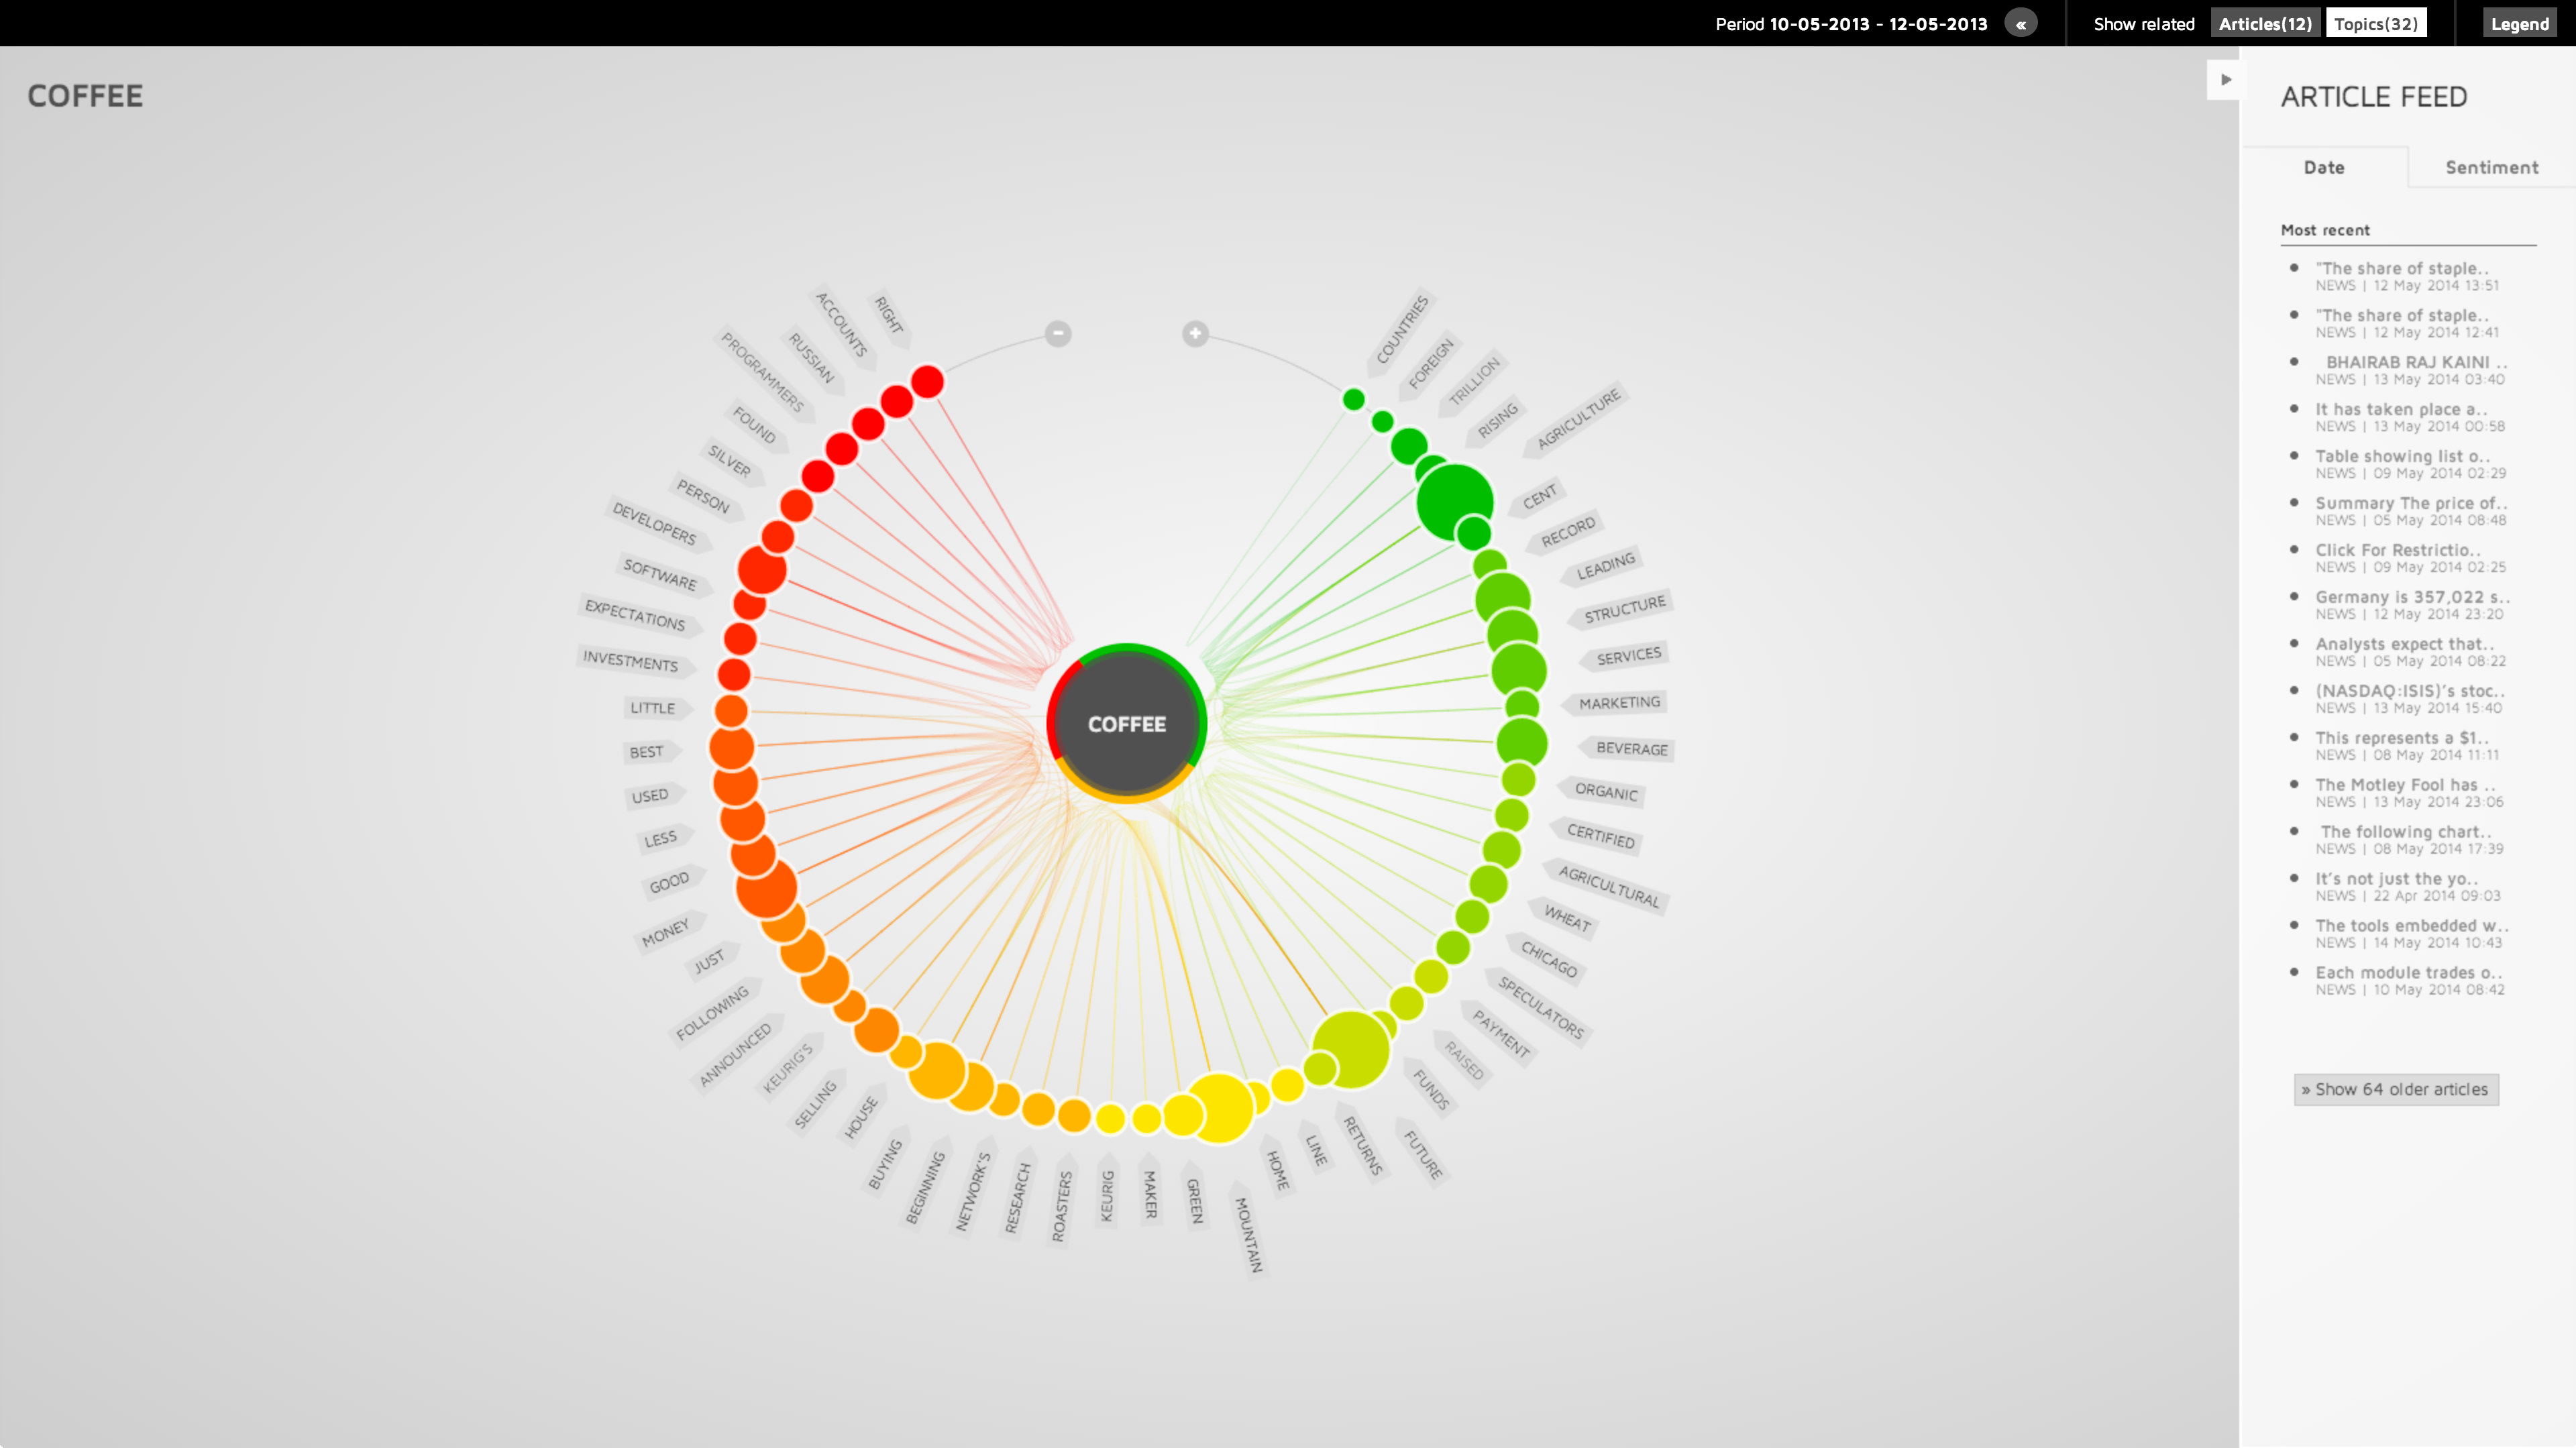
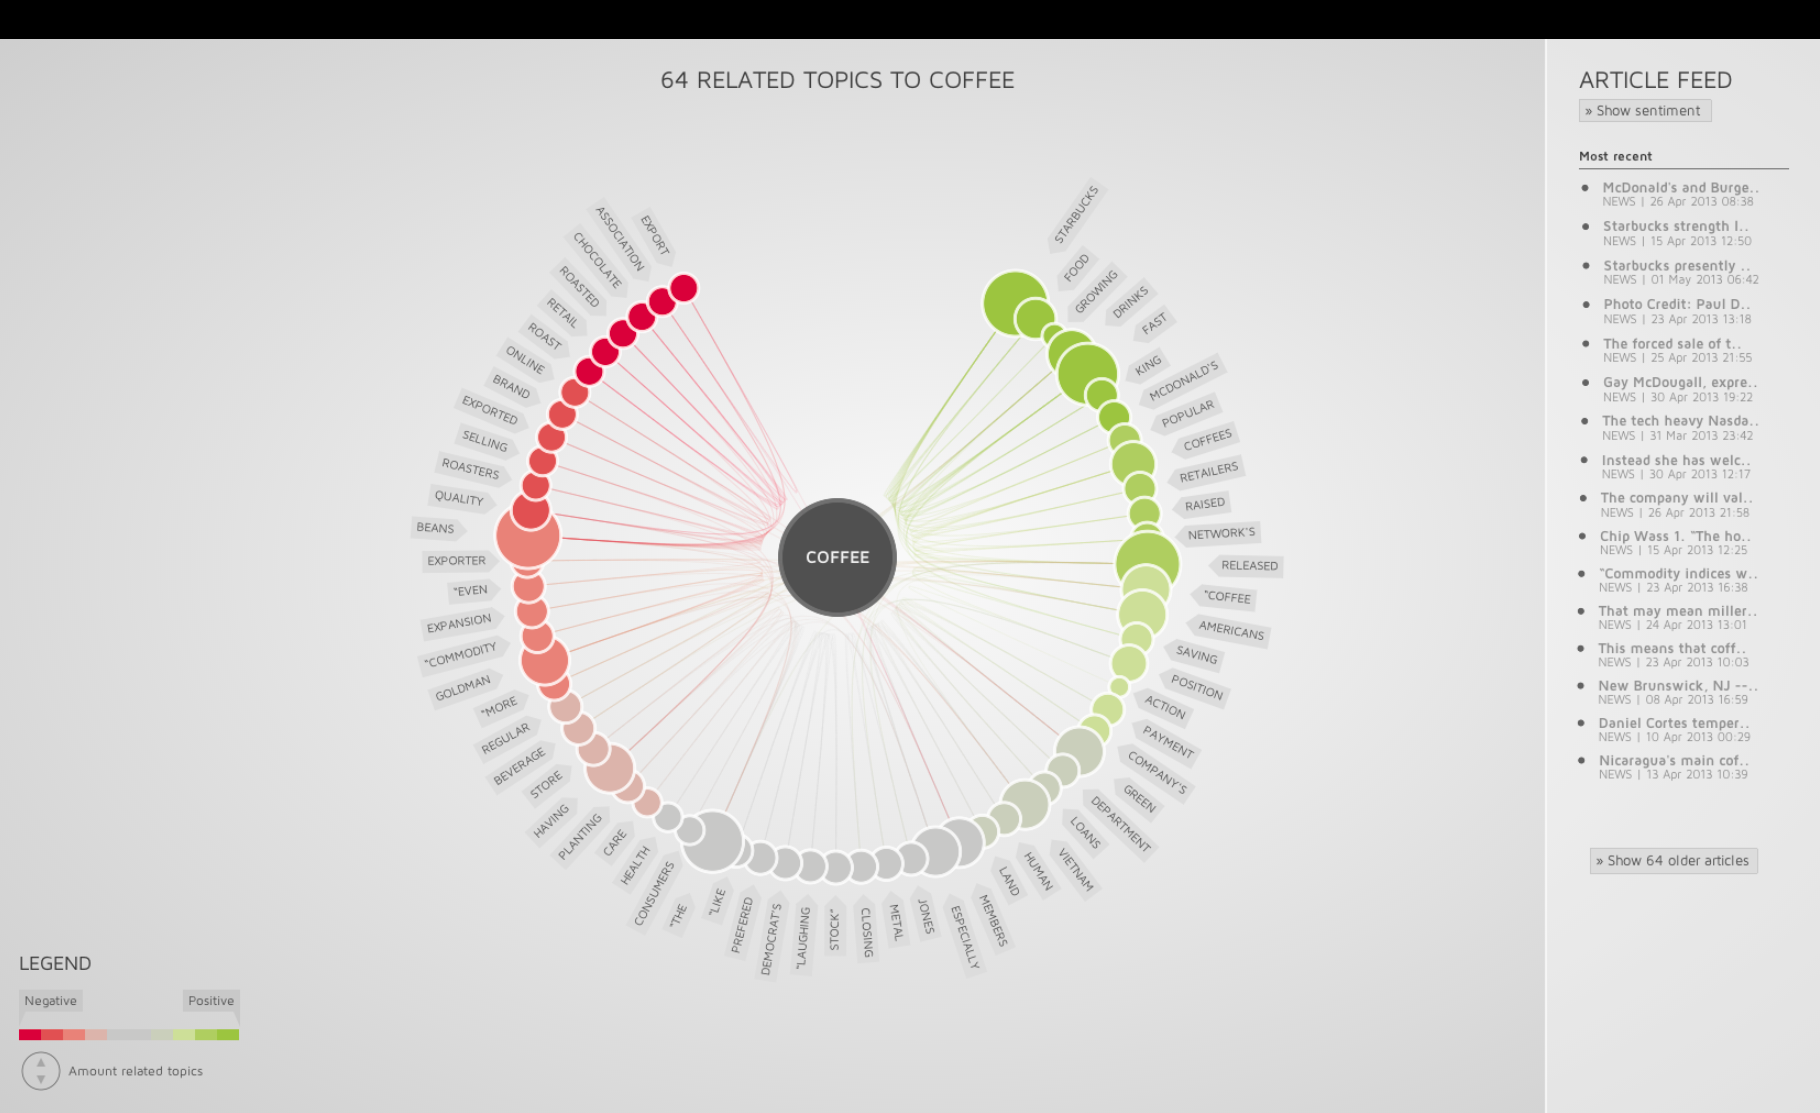
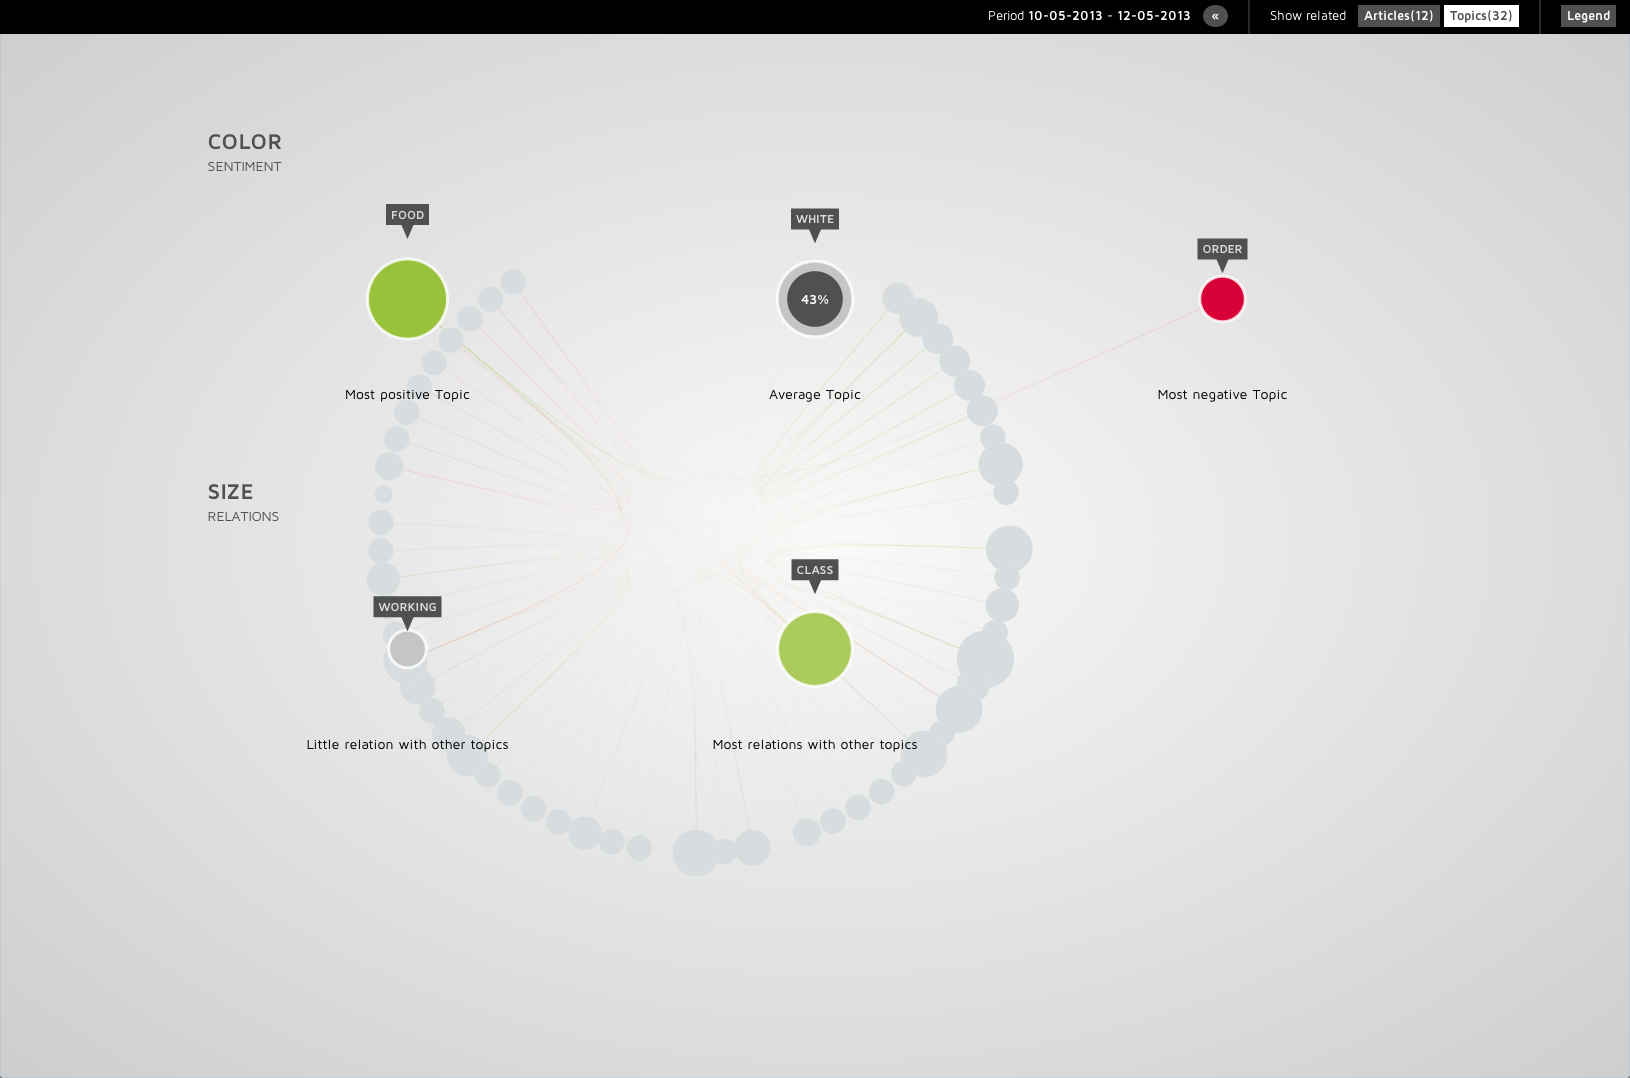
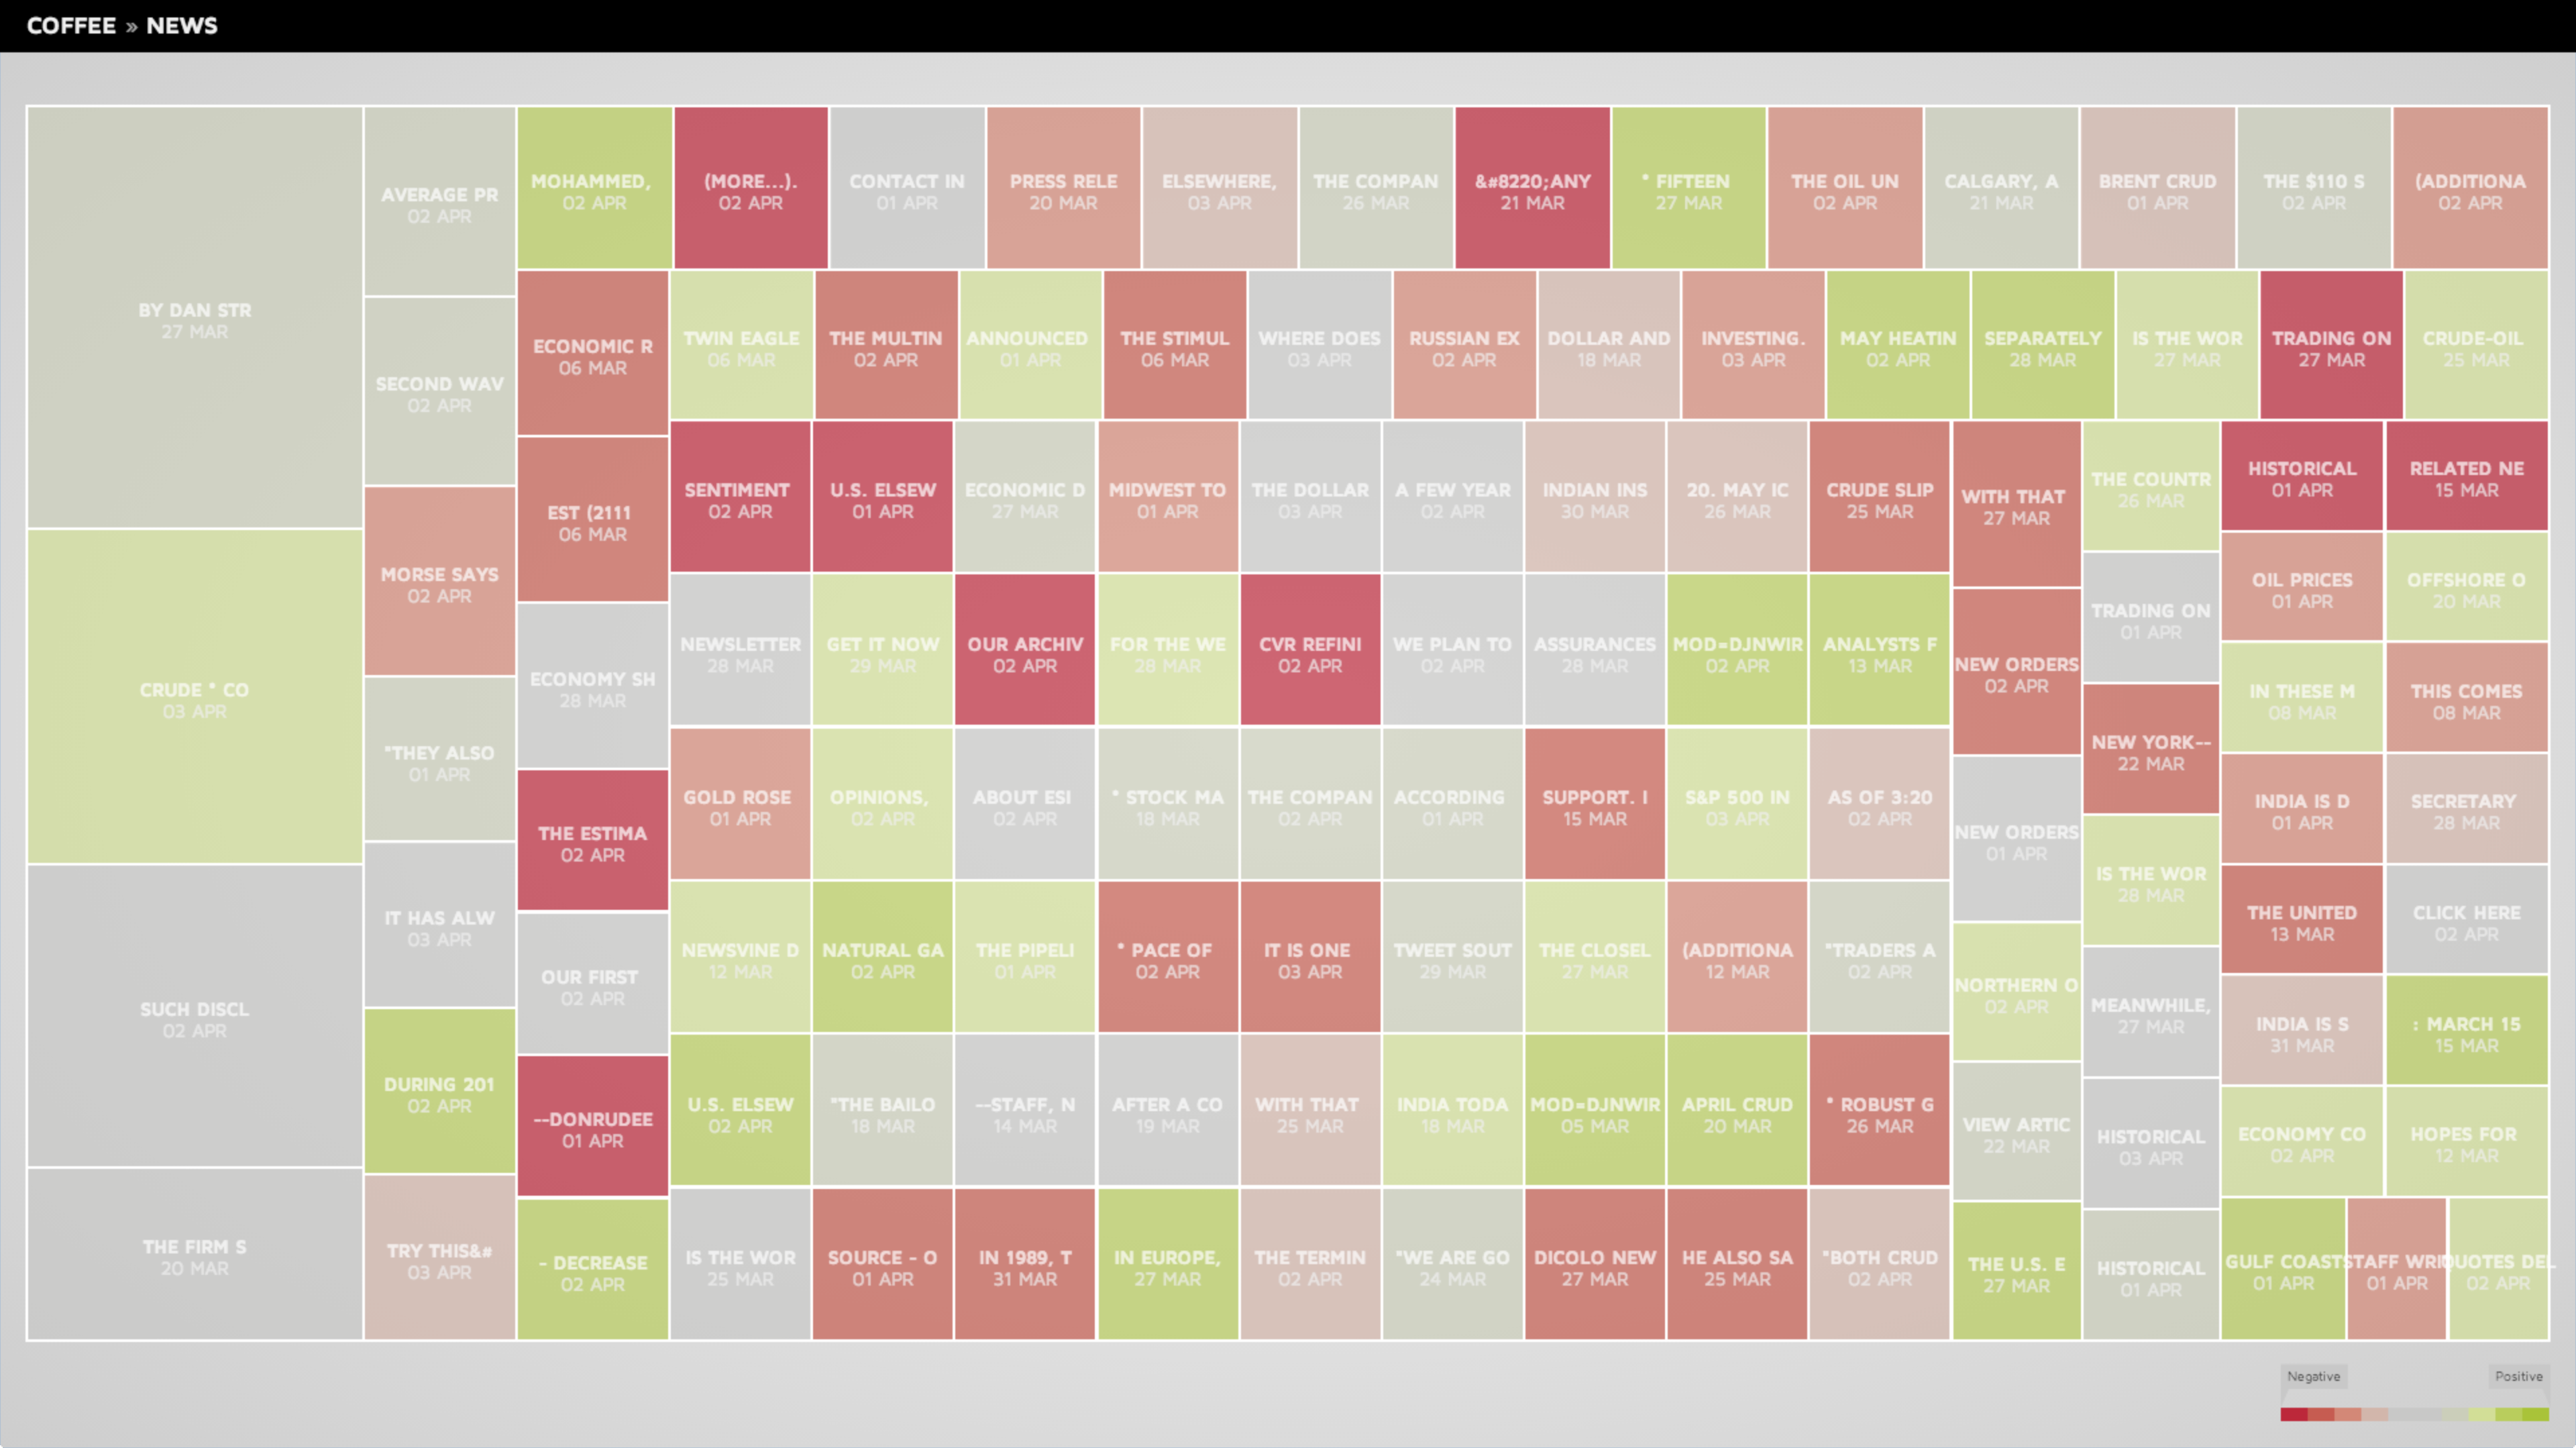
• Skip to main navigation
  • Skip to main content
  • Skip to footer
  • Work
  • About
  • Contact
  • ↳ Freelance Services
  • Skip to menu toggle button

Jonas Groot Kormelink

Data Visualisation, Senior Front-end Developer & Creative Technologist.

  • Pinterest
  • LinkedIn
  • Github
  • BlueSky
  • Back to top ↑

TrendViz – Experiments

Posted on: 07/05/2014 Last updated on: 10/01/2021 Categorized in: CLEVER°FRANKE Experiment Written by: admin

Various visualization and technical experiments regarding TrendViz.

Tagged as: C°F Data Data Visualization Experiment Interactive Javascript PHP Processing.js Tool
Skip back to main navigation

Post navigation

Previous Post TrendViz
Next Post MultiViz

Tags

3D (8) Abstract (7) Analog (9) Audio (4) Australia (4) Bookmarking (3) Chicago (3) C°F (25) D3.js (27) Data (34) Database (10) Data Driven (5) Data Visualization (40) Experiment (41) Generated (4) Generative (10) Geography (11) GLSL (5) Google Maps (4) GraphQL (4) Illustrator (7) Interactive (60) Javascript (38) Live (3) Map (12) MapBoxGL (5) Motion (5) P5.js (6) Particles (4) PHP (26) Pixels (4) Print (3) Privacy (3) Processing (32) Reactjs (10) Sensors (6) Shader (4) Thesis (5) Three.js (15) Tool (7) Video (5) Weather (6) Web (40) WebGL (13) Website (6)

Categories

Art Academy Project (36) CLEVER°FRANKE Experiment (15) CLEVER°FRANKE Project (14) DataLabs Experiment (2) DataLabs Project (2) More Yum Project (7) Personal Experiment (21) Personal Project (3)
2026 Jonas Groot Kormelink - Sandbox
  • Pinterest
  • LinkedIn
  • Github
  • BlueSky
  • Back to top ↑