• Skip to main navigation
  • Skip to main content
  • Skip to footer
  • Home
  • About
  • Contact
  • Skip to menu toggle button

Jonas Groot Kormelink

Sandbox

  • LinkedIn
  • Twitter
  • Pinterest
  • Back to top ↑

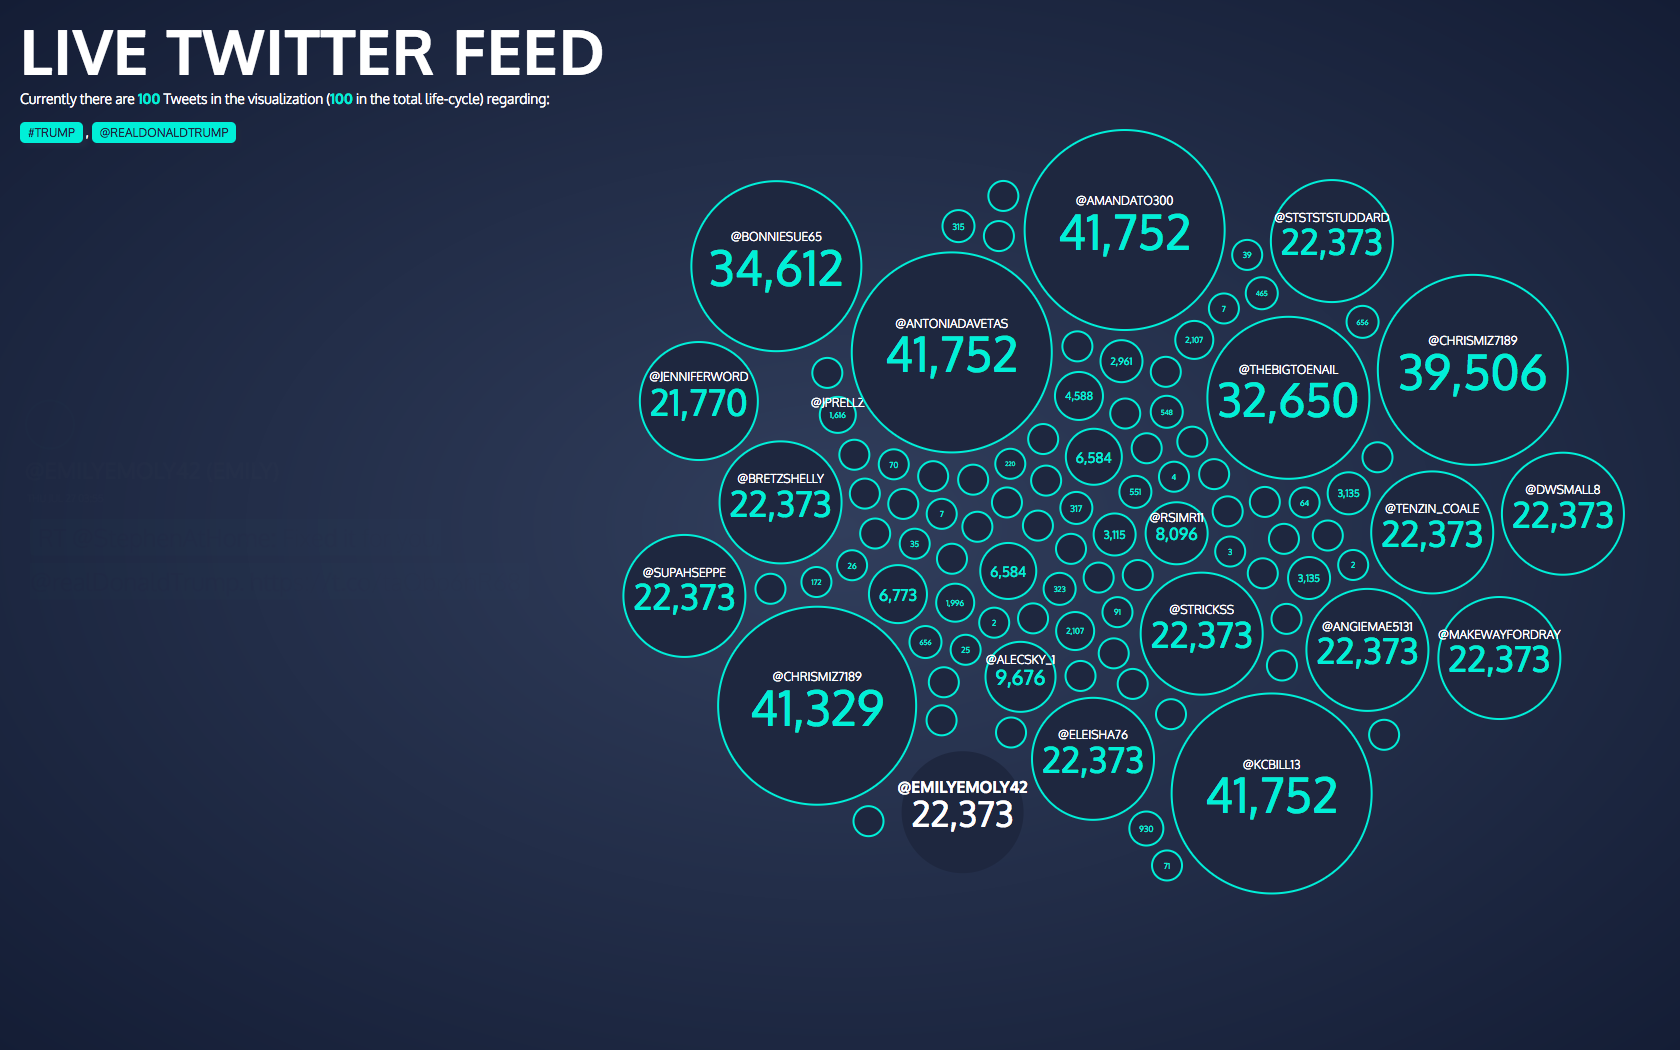
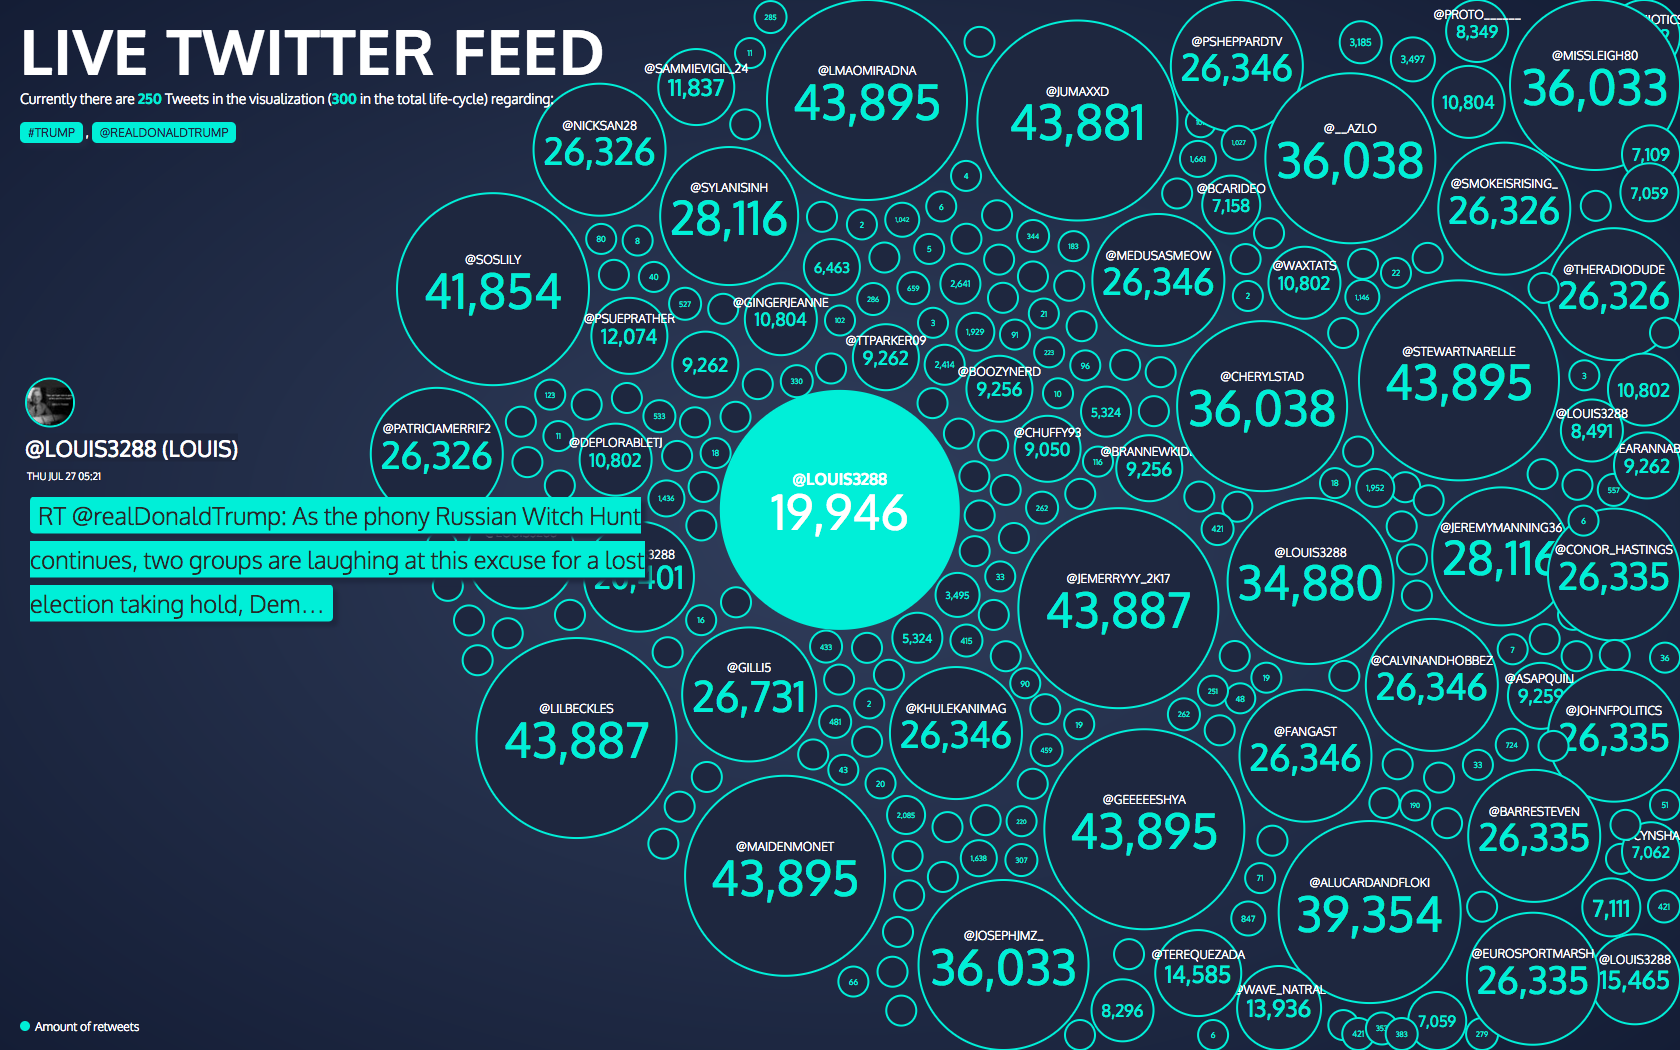
Generative Twitter Visualization

Posted on: 03/08/2017 Last updated on: 10/01/2021 Categorized in: Personal Experiment Written by: admin

With this tool any topic can be visualized by using a Twitter search query.

The content will auto update after a few minutes, keeping the visualization alive.

> Live Version

Tagged as: D3 Data Data Visualization Interactive Javascript Live PHP Social Twitter Web
Skip back to main navigation

Post navigation

Previous Post Victoria Accident Map
Next Post SEEK: Laws of Attraction

Tags

3D (8) A/V (3) Analog (9) Angular (2) Audio (3) Australia (4) Bookmarking (3) Chicago (3) C°F (24) D3 (25) Data (33) Database (10) Data Driven (4) Datalabs (3) Data Visualization (39) Experiment (33) Festival (3) Generated (4) Generative (4) Geography (11) Google Maps (3) Illustrator (7) Interactive (50) Javascript (29) Live (3) Map (12) MapBox (3) MapBoxGL (3) PHP (26) Print (3) Privacy (3) Processing (32) Reactjs (4) Sensors (6) Slit-scan (3) Thesis (5) Three (11) Tool (5) Video (5) Virtual City (3) Weather (6) Weather-chart (3) Web (29) WebGL (13) World (3)

Categories

Art Academy Project (36) CLEVER°FRANKE Experiment (12) CLEVER°FRANKE Project (13) DataLabs Experiment (2) DataLabs Project (2) Personal Experiment (16) Personal Project (3)
2023 Jonas Groot Kormelink - Sandbox
  • LinkedIn
  • Twitter
  • Pinterest
  • Back to top ↑